How to Create a Highly Effective Sales KPI Dashboard
- October 10, 2024
-
Hazal Demir

Monitoring and analyzing sales performance is critical for helping businesses reach their growth goals. To do this effectively, companies need a reliable way to track key metrics and make informed, strategic decisions. This is where a sales KPI (Key Performance Indicator) dashboard becomes essential.
In this guide, we’ll walk you through the steps to create a high-impact sales KPI dashboard, from defining goals to choosing the right metrics and visualizing performance.
What is a KPI?
Key Performance Indicators (KPIs) are measurable values that help businesses track their progress toward specific objectives. In sales, KPIs provide insight into how well teams are performing in areas such as lead generation, customer retention, and revenue growth.
A well-defined KPI is:
- Specific
- Measurable
- Aligned with business goals
- Actionable
- Time-bound
For example:
- ✅ Good KPI: “Increase new customer acquisition by 20% by Q1.”
- ❌ Poor KPI: “We should increase sales.”
Effective KPIs not only track current performance but also inform future strategies by highlighting trends, gaps, and opportunities.
How to Build a High-Impact Sales KPI Dashboard

Creating a powerful sales dashboard requires careful planning and smart execution. Here’s a step-by-step roadmap:
1. Set Clear Sales Goals
Your dashboard should be aligned with clearly defined sales goals. These goals should follow the SMART criteria: Specific, Measurable, Achievable, Relevant, and Time-bound.
Example:
- ✅ Goal: “Increase new customer acquisition rate by 20% by the end of Q1.”
- ❌ Vague: “We need to sell more.”
Defining targeted objectives ensures that your KPI dashboard reflects relevant and actionable insights.

2. Choose the Right KPIs
Each business has unique priorities. Select KPIs that align with your sales model, business objectives, and customer journey.
Common Sales KPIs:
- Customer Acquisition Cost (CAC):
Total cost of acquiring new customers, including marketing and sales spend. - Conversion Rate:
The percentage of leads that turn into paying customers. - Average Time to Close a Sale:
Tracks how long it takes from first contact to final purchase—useful for identifying process bottlenecks. - Lead-to-Opportunity Ratio:
Measures lead quality and helps assess sales funnel efficiency. - Revenue per Sales Rep:
Tracks individual performance and productivity.
3. Identify Data Sources

The accuracy of your KPI dashboard depends on the quality and reliability of your data. Identify and connect data sources such as:
- CRM Systems (e.g., HubSpot, Salesforce): Track customer interactions and rep performance.
- Marketing Platforms (e.g., Google Analytics): Analyze website traffic, conversion paths, and campaign effectiveness.
- Internal Sales Reports: Import offline sales activity or historical performance data.
- Customer Feedback Tools: Add qualitative insight into satisfaction and complaints.
4. Visualize Your KPIs Effectively
Raw data is powerful—but only when it’s easily understood. Visualization is key to making KPIs actionable.
Tips for visualization:
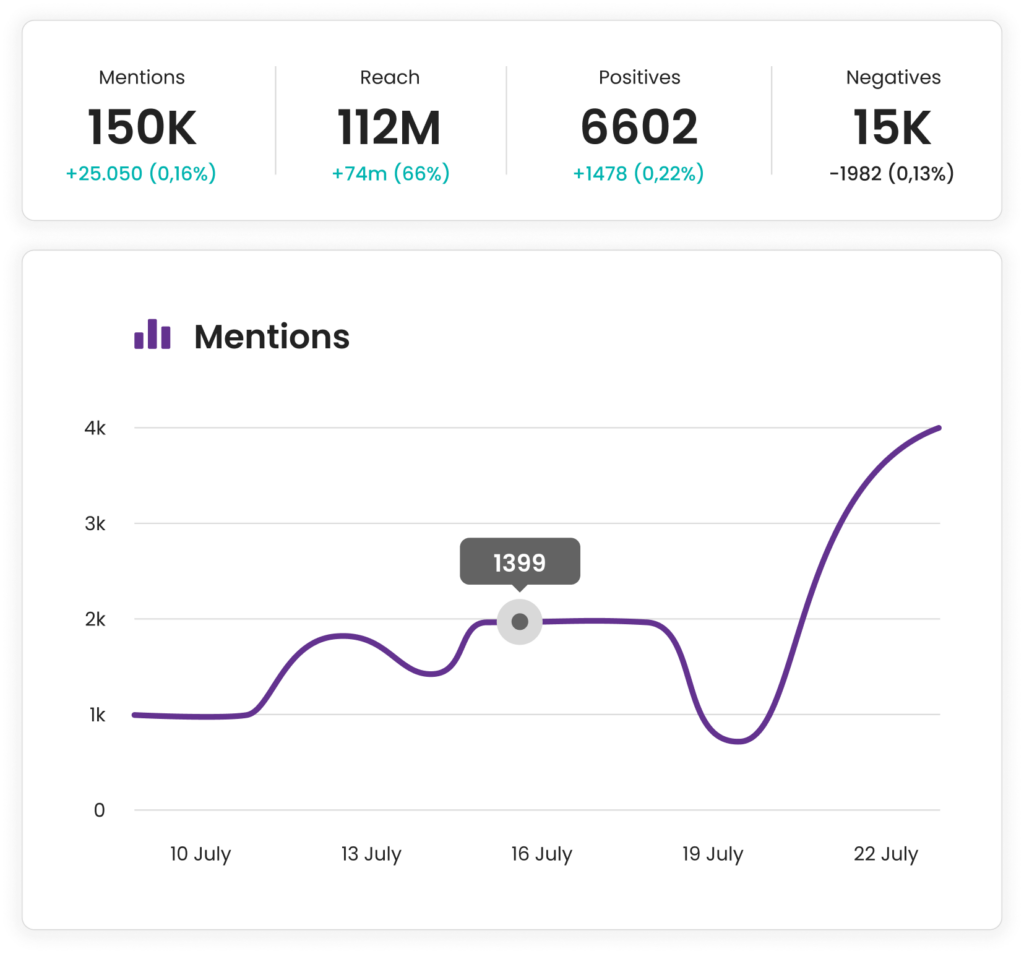
- Use bar charts, line graphs, gauges, or heatmaps to show trends and performance over time.
- Apply color-coding (e.g., green for success, red for areas needing improvement).
- Include filters to segment data by product, team, region, or time period.
Example:
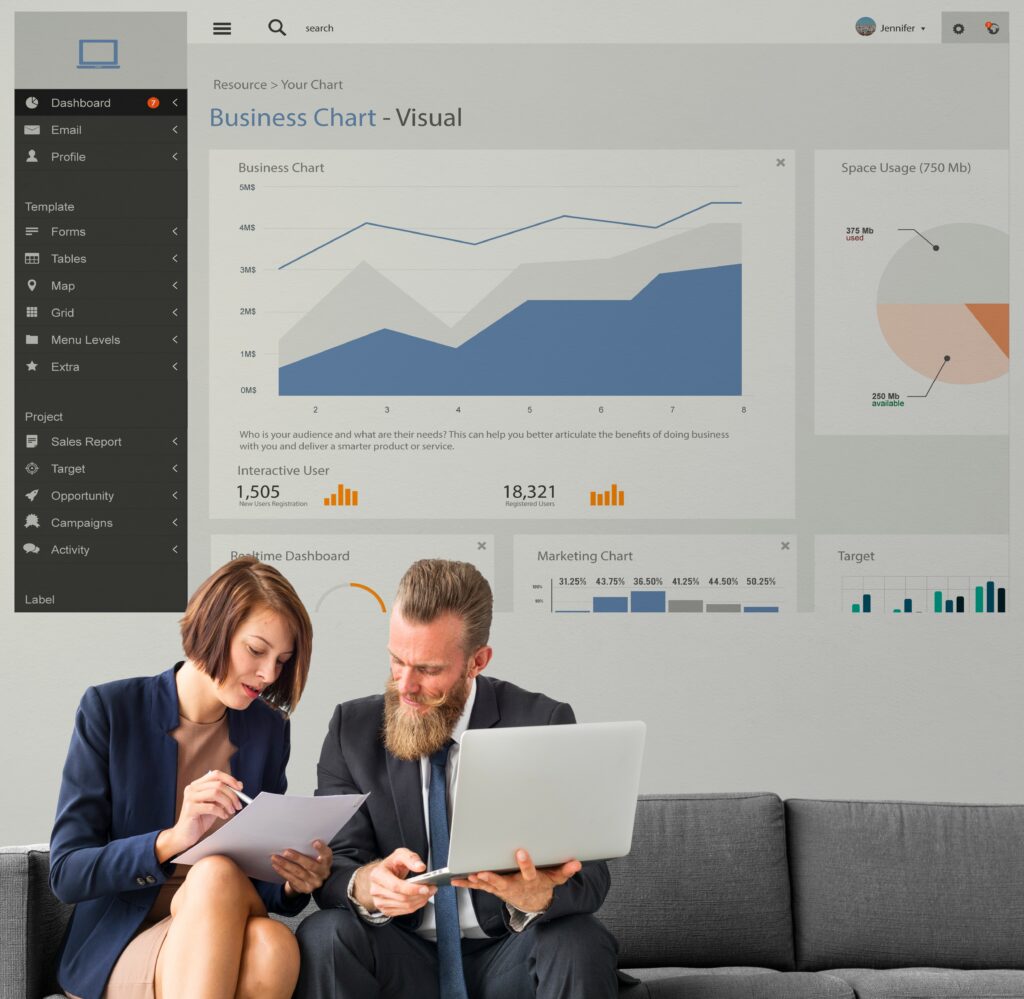
A graph showing monthly sales trends highlights seasonality and alerts you to dips in performance.

5. Monitor and Refine KPIs Regularly
A KPI dashboard isn’t static—it should evolve as your business grows. Revisit your KPIs periodically to:
- Adjust metrics that are no longer relevant
- Add new KPIs aligned with updated goals
- Refine thresholds or benchmarks as performance improves
Example:
- If a conversion rate starts dropping, investigate the issue and revise your strategy accordingly.
6. Customize Dashboards for Your Business
There’s no one-size-fits-all dashboard. Customize your KPIs based on your sales structure, target market, and business model.
Example:
- Retail Business: Focus on average basket size, return rates, and store conversion.
- SaaS Business: Use metrics like monthly recurring revenue (MRR), churn rate, and customer lifetime value (CLTV).
- Service-Based Business: Track client onboarding time, first-call resolution, and customer satisfaction score (CSAT).
Grispi’s KPI Dashboard Features & Advantages
Grispi empowers businesses with real-time, customizable KPI dashboards that track sales performance across multiple channels. Here’s how it supports your sales strategy:
✔️ Customizable Dashboards
Choose the KPIs that matter most and tailor the layout to match your sales funnel and reporting needs.
✔️ Real-Time Monitoring
Instantly track team performance, campaign outcomes, and individual KPIs as data updates live.
✔️ Integrated Data Sources
Connect CRM, marketing, and support tools to consolidate all your insights in one place.
✔️ Actionable Visualization
Use graphs, tables, and heatmaps to spot trends and identify issues before they impact performance.
✔️ Smart Decision Support
Set performance thresholds and receive alerts or insights when targets are missed or exceeded.
Grispi Prices
- Start-up: $7
- Level Up: $14
- Enterprise: 39$
An effective sales KPI dashboard is a vital tool for driving business growth. By setting clear goals, choosing meaningful KPIs, visualizing performance, and making continuous improvements, your team can work smarter and achieve better results.
Tools like Grispi make the process faster, smarter, and more strategic. Start building your custom KPI dashboard today—and turn your data into growth.
Contact us
Fill out the form for detailed information and demo account, let us call you.